
Efficient Frontier: Overview, Limitations, and its Role in Portfolio Optimization
- Peak Frameworks Team

- Apr 1
- 5 min read
If you're interested in breaking into finance, check out our Private Equity Course and Investment Banking Course, which help thousands of candidates land top jobs every year.
What is the Efficient Frontier?
The Efficient Frontier is a curve on a graph that represents a range of optimal investment portfolios.
It was introduced by Harry Markowitz in 1952 as part of his Modern Portfolio Theory (MPT).
The curve illustrates the trade-off between risk and return, and each point on the curve represents a portfolio that has the maximum possible return for a specific level of risk.
Key Components of the Efficient Frontier
Expected Return: This is the anticipated average return that a portfolio is expected to generate based on historical data or market predictions.
Risk (Standard Deviation): In the context of portfolio theory, risk is measured by the standard deviation of portfolio returns. It shows how much the return on the portfolio is likely to fluctuate.
Portfolio Diversification: Diversification refers to holding a variety of assets to reduce the overall risk. A well-diversified portfolio is key to achieving a position on the Efficient Frontier.
Correlation: The degree to which different assets move in relation to each other. Low or negative correlations between assets can reduce overall portfolio risk.
How the Efficient Frontier Works
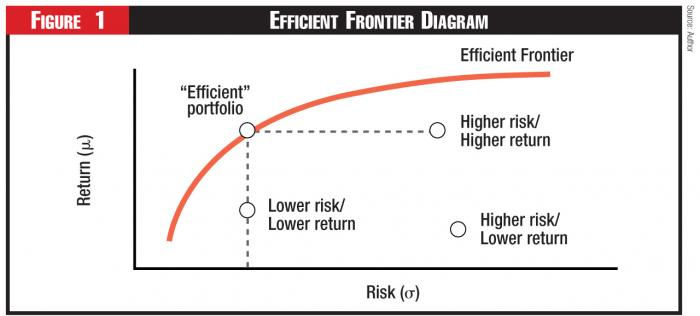
To understand the Efficient Frontier, imagine plotting various portfolios on a graph where:
The X-axis represents risk (standard deviation of returns).
The Y-axis represents the expected return.
Each portfolio can be represented as a point on this graph. The Efficient Frontier is the upward-sloping curve that forms the upper boundary of these points. Portfolios that lie below this curve are considered suboptimal because they provide lower returns for a given level of risk.
Portfolios that lie on the Efficient Frontier, however, are optimized, providing the best possible return for their risk level.
Visual Representation of the Efficient Frontier
A typical graph of the Efficient Frontier will look like an arc that starts from the left (low risk, low return) and moves upwards and to the right (higher risk, higher return). The curve usually becomes steeper as the risk increases, indicating that additional risk does not always result in proportionately higher returns.
Capital Market Line (CML)
The Capital Market Line (CML) is a special line that intersects the Efficient Frontier at the optimal portfolio known as the tangency portfolio. The CML represents portfolios that combine the risk-free asset with the tangency portfolio. It provides a higher return for each level of risk compared to other portfolios on the Efficient Frontier.
The Role of the Efficient Frontier in Portfolio Optimization
1. Risk-Return Trade-Off Analysis
The primary purpose of the Efficient Frontier is to help investors make decisions based on their risk tolerance and return expectations. It allows investors to see how much risk they are taking for a given level of return and compare different portfolio options.
2. Constructing Optimal Portfolios
The Efficient Frontier can be used to construct portfolios that are best suited to the investor’s goals:
Conservative Investors: Prefer portfolios that are located on the left side of the frontier, indicating lower risk and lower return.
Aggressive Investors: Prefer portfolios that are on the right side, indicating higher risk and potentially higher returns.
3. Finding the Tangency Portfolio
The tangency portfolio, where the CML touches the Efficient Frontier, represents the optimal risky portfolio. When combined with a risk-free asset, this portfolio achieves the best possible Sharpe ratio, providing the highest excess return per unit of risk.
4. Sharpe Ratio Maximization
The Sharpe Ratio, which measures the excess return per unit of risk, is maximized at the tangency point of the Efficient Frontier. Investors often aim to achieve a higher Sharpe Ratio, as it indicates better risk-adjusted returns.
Limitations of the Efficient Frontier
While the Efficient Frontier is a powerful tool in portfolio management, it does have some limitations:
1. Dependence on Historical Data
The expected return and standard deviation used in calculating the Efficient Frontier are often based on historical data, which may not always predict future performance accurately.
2. Simplistic Assumptions
The model assumes that investors are rational and markets are efficient, which may not always be true in real-world scenarios. It also assumes that risk can be completely captured by standard deviation, which ignores other forms of risk.
3. Ignores Tail Risk
The Efficient Frontier does not account for extreme events or tail risks (e.g., black swan events), which can significantly impact the performance of a portfolio.
Efficient Frontier vs. Individual Asset Selection
The Efficient Frontier provides a broader perspective on portfolio management by considering the overall mix of assets rather than focusing on individual assets. Instead of picking stocks based solely on their risk and return characteristics, the Efficient Frontier evaluates the collective performance of a group of assets, considering their correlation and overall impact on the portfolio’s risk and return.
Example: Building a Portfolio with the Efficient Frontier
Suppose an investor is considering three assets: Stock A, Stock B, and a Bond Fund. Individually, Stock A has a high return and high risk, Stock B has a moderate return and moderate risk, and the Bond Fund has a low return and low risk.
By plotting the risk and return of different combinations of these assets, the investor can identify which portfolios lie on the Efficient Frontier.
For example:
Portfolio 1: 50% Stock A, 30% Stock B, 20% Bond Fund
Portfolio 2: 40% Stock A, 40% Stock B, 20% Bond Fund
The first portfolio might offer a higher return but also come with higher risk. The second portfolio could lie on the Efficient Frontier, offering a better risk-return balance. This helps the investor make a more informed decision.
Practical Application: Using the Efficient Frontier in Real Life
Many financial advisors and portfolio managers use the Efficient Frontier as part of their investment strategy. Software tools like MATLAB, R, and Python have built-in libraries to calculate and visualize the Efficient Frontier. By inputting the expected returns, standard deviations, and correlation matrix of the assets, these tools can generate the frontier curve, making it easier to identify optimal portfolios.
Steps to Build an Efficient Frontier
Define Asset Classes: Select a diverse set of asset classes (e.g., equities, bonds, commodities).
Estimate Returns and Risks: Use historical data or forecasts to determine expected returns and risks.
Create a Correlation Matrix: Calculate the correlation between each pair of assets.
Generate Portfolios: Combine assets in different weights to create a range of portfolios.
Plot the Efficient Frontier: Identify the portfolios that offer the best risk-return trade-off.
Choose Optimal Portfolio: Select the portfolio that aligns with your risk tolerance and return objectives.
Conclusion
The Efficient Frontier is an invaluable concept in portfolio management, helping investors understand the trade-off between risk and return. By constructing and analyzing the Efficient Frontier, investors can identify portfolios that maximize returns for a given level of risk. While the theory has limitations, it remains a crucial tool for financial professionals seeking to optimize portfolio performance.
Understanding the Efficient Frontier, along with related concepts like the Capital Market Line and Sharpe Ratio, allows investors to make more informed decisions and build portfolios that are tailored to their specific risk-return preferences.


